HOWTO Use CodeCover: From code to report, a complete walkthrough
Introduction & General Preconditions
This document describes the usage of the CodeCover Eclipse plugin, using the sample Java application "SimpleJavaApp". This application is the "system under test" (SUT). In this document we describe how CodeCover instruments and executes the SUT, and how the test results can be visualized and reported. We will not discuss the installation of the Eclipse plugin, which is covered in the installation guide.
The prerequisites for using this tutorial are:- Basic knowledge of Eclipse usage, such as creating a run configuration and opening views.
- The CodeCover Eclipse plugin must be installed.
SimpleJavaApp
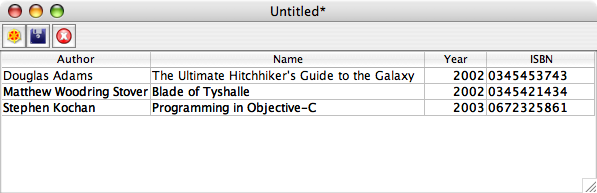
"SimpleJavaApp" is a small swing application. It is used to display and edit lists of books. It can save and load these lists as XML files. Below is a screenshot of the application.
Open your Eclipse installation and import "SimpleJavaApp" into your workspace. Navigate to the "Import" entry in the "File" menu in Eclipse and choose "Existing Projects into Workspace" under the "General" category. Browse to the folder you placed the sources in. You can get these sources here, as .zip or .tar.bz2.
Enable CodeCover
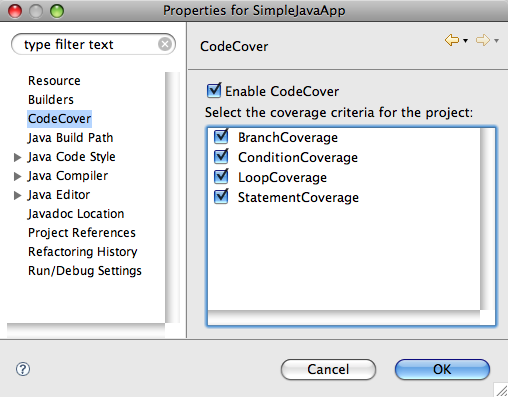
You need to enable CodeCover for the imported project to measure its coverage. Open the project properties dialog of the project and navigate to the CodeCover category. Select the checkbox as shown in the screenshot below. You have now activated CodeCover for the "SimpleJavaApp" project. You also need to select the coverage criteria to be used in the instrumentation. In this case all available criteria were selected.
Use for Coverage Measurement
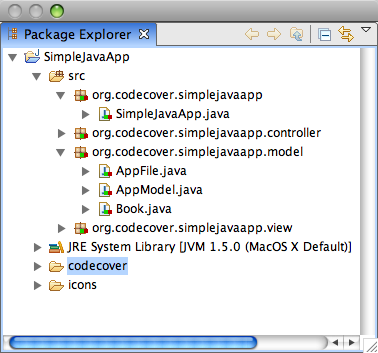
Select the classes you want to instrument. Open the package explorer view, navigate to the source folder of the "SimpleJavaApp" project and select those classes you want to be instrumented. Open the context menu of this selection and select the "Use For Coverage Measurement" entry. This will mark the selected items – as shown in the screenshot below – with an icon. In this tutorial, all classes of the "SimpleJavaApp" are selected for instrumentation.
Run with CodeCover
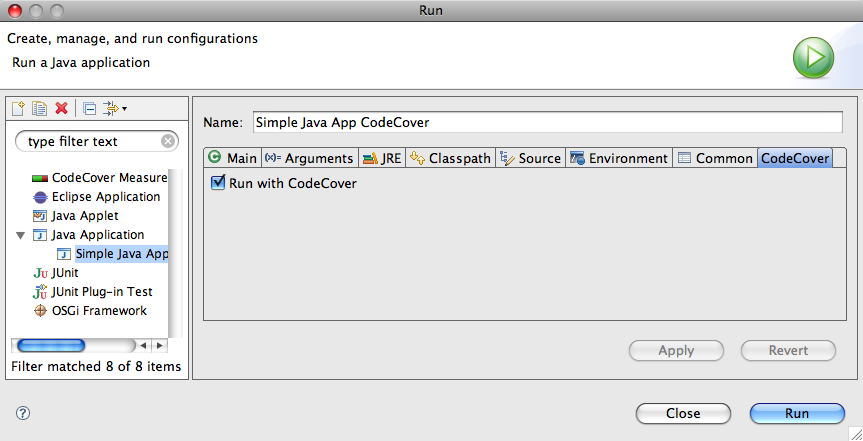
You need to tell Eclipse to use CodeCover. This is done in the "run configuration" dialog. You can reuse existing configurations or create new ones. Navigate to the CodeCover tab in the configuration and select the "Run with CodeCover" checkbox.
Execution
There are several ways to execute the SUT. You can choose to start the application as usually, in which case all the measured data is collected into a single test case. Or you can use the "Live Notification" feature and record individual test cases. Or you can use your existing JUnit test suite to define the test cases for you. To perform a normal execution just read on, to proceed with the Live Notification, skip ahead to this section, to proceed with the JUnit execution, skip ahead here.
Normal Execution
You simply need to run the previously created run configuration. CodeCover measures the SUT in the background. Perform your test activities. After terminating the SUT, the measurements are automatically stored as a test case in a test session called "eclipserun". You can view the measurements with the views in Eclipse, or create an HTML report from the measured data.
Live Notification execution
One additional step needs to be taken to use live notification. Open the arguments tab of your run configuration and enter the following parameters into the VM arguments:
NOTE: You need to remove any line breaks in the VM arguments text field, since they can lead to malfunctions.
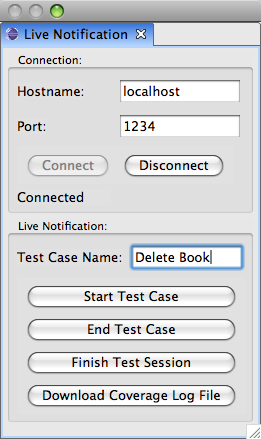
Start the SUT with the run configuration. Open the "Live Notification" view in Eclipse. Enter "localhost" as the hostname and "1234" as the port. Press the "Connect" button. Live notification is now activated.
Enter a name for a test case and start it with the "Start Test Case" button. Perform your test activities, e.g. delete a book. End the test case with the "End Test Case" button. You can record more test cases by repeating the above. To finish recording, use the "Finish Test Session" button. You do not need to use the "Download Coverage Log File" button, since SimpleJavaApp is not a web application (see FAQ). After terminating the SUT, the measurements are automatically stored in a test session called "eclipserun".
You can view the measurements with the views in Eclipse, or create an HTML report from the measured data.
JUnit execution
To use your existing test suite you need to create a new "CodeCover Measurement For JUnit" run configuration. As show in the screenshot below it is required to select the class which contains your JUnit test cases or test suite. You can choose to use either JUnit 3 or JUnit 4 as your test runner, depending on which your existing test suite is based on. Start the SUT with the run configuration to start the measurement. After terminating, the measurements are automatically stored in a test session called "eclipserun", which holds all the test cases your test suite defined.

You can view the measurements with the views in Eclipse, or create an HTML report from the measured data.
View measured data in Eclipse
This section describes the basic uses of each view CodeCover provides. You can skip ahead to the report section to immediately create a report.
Test Sessions View
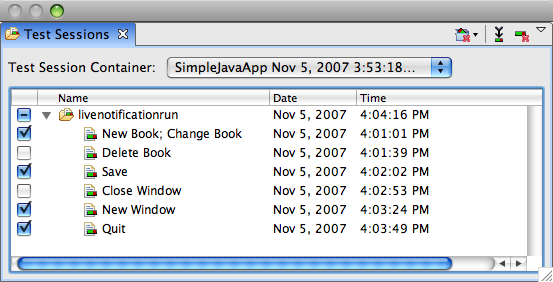
This view displays the test sessions and test cases in a test session container. You can select, deselect, rename, delete and merge them. Other views use only the selected test cases for their visualization.
Coverage View
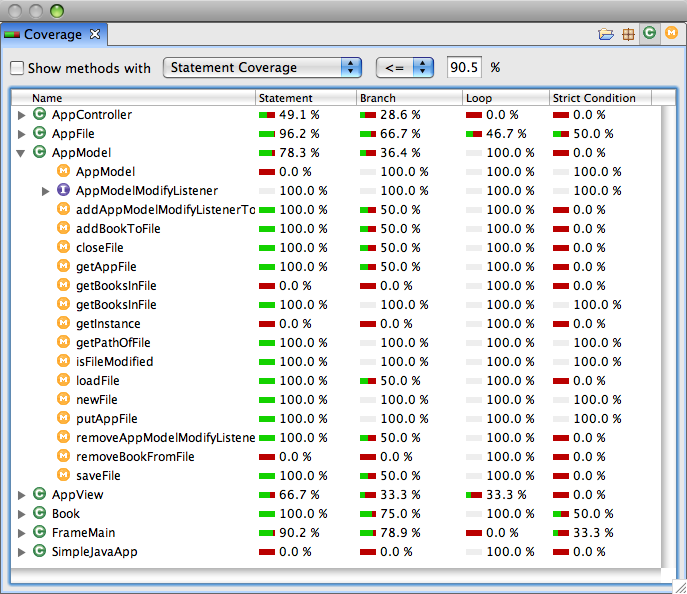
In this view you can see the coverage of individual parts of the SUT. As shown in the screenshot below, every metric has its own column.
Correlation View
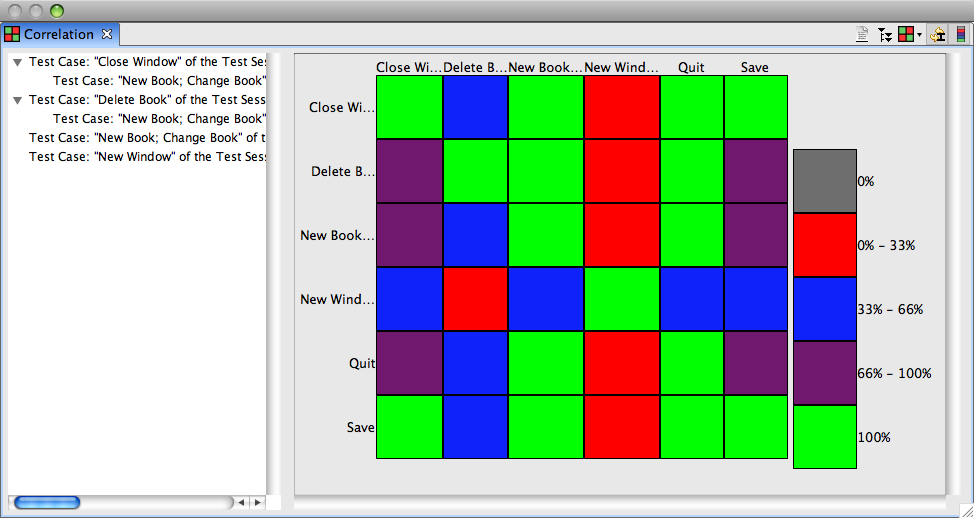
This view is used to compare test cases with each other. You can hover over each block in the matrix and see by how much one test case covers the same parts of the code as another test case. The tree displays test cases, that completely cover the pars of the code that other test cases cover, in a hierarchy. You can choose to export the data of the matrix into a "comma separated value" file which is compatible with most spreadsheet applications.
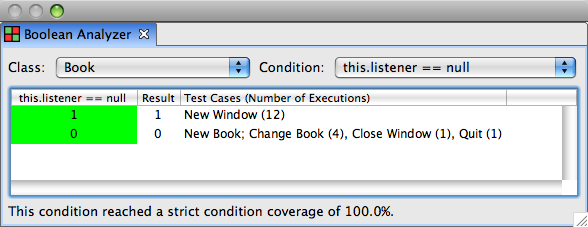
Boolean Analyzer
With this view, you can display the measured assignments of conditions and see the coverage of the condition. You can select the keyword of the condition in the source code, right-click, and select the "Analyze Term" item in the context menu, which will automatically select the condition in the Boolean Analyzer.
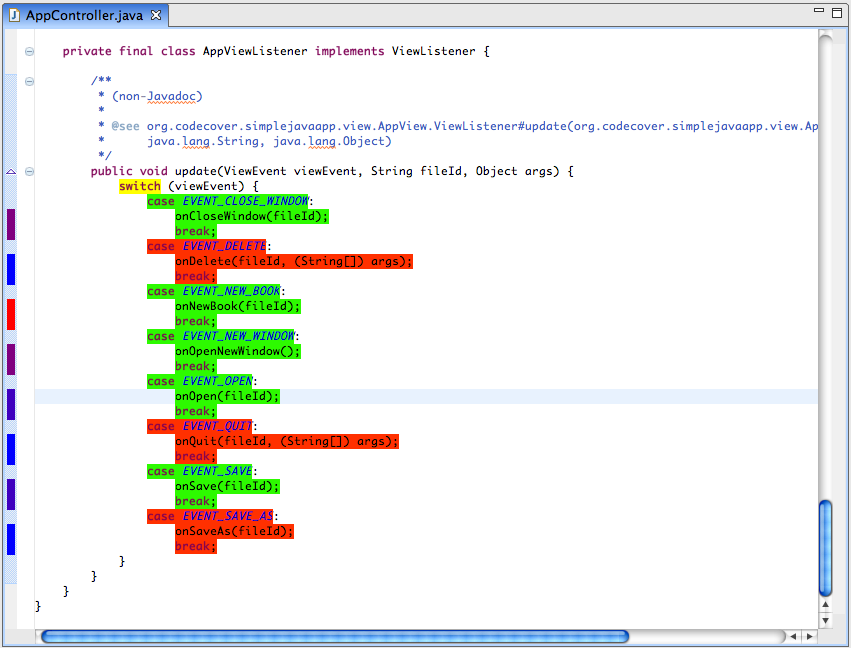
Code Highlighting & Hot Path
The source code is highlighted according to the measured data. This is only available if the source file hasn't changed since the measurement was done. As you can see in the screenshot below, the onQuit(...) and onSaveAs(...) methods were not executed during the measurement of the SUT.
The hot path of the source file is shown on the left side of the editor. The more often a statement was executed, the more red the color becomes. The onNewBook(...) method was executed more often than other methods, so the color is red.
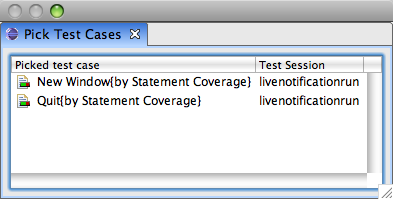
Pick Test Case View
This view shows which test cases cover a certain part of the code, e.g. which test cases executed the onNewWindow() method. It tracks the selection in the currently opened editor and displays a (possibly empty) list of test cases. The test session of the test case is also displayed.
Export Report
You can export the measured data as an HTML report. Navigate to the "Export" entry in the "File" menu in Eclipse and choose "Coverage Result Export" under the "CodeCover" category. Select the test session container which contains the test sessions you wish to export. Set the export type to "Report". You need to choose a destination for the report files. The screenshot displays a possible configuration.
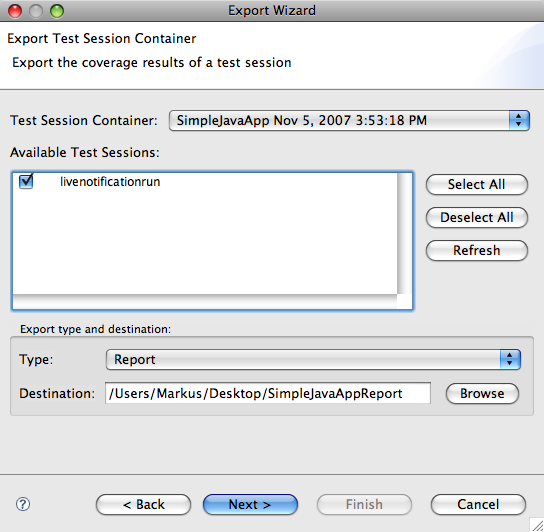
Press the "Next" button to choose the template for the report.
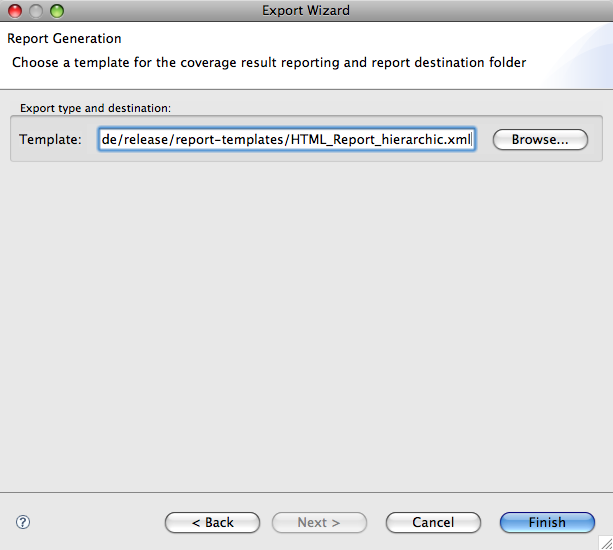
The report will be created at the specified location when you click the "Finish" button.
Example Report
The created report is available here.