Eclipse Plugin Reference
- Build
- Correlation Matrix
- Test Session View
- Coverage View
- Boolean Analyzer
- Highlighting
- Import Wizards
- Export Wizards
- CodeCover Measurement for JUnit
- Live Notification
- Preferences
Build
Selecting the files to instrument:
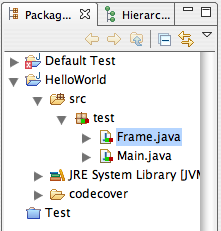
Open the Package Explorer view. Choose the Java Classes and Packages you want to instrument and open the context menu by right-clicking on the selected items. The menu item "Use For Coverage Measurement" allows you to toggle the instrumentation state of the selected items.
Enabling CodeCover for a Java project:
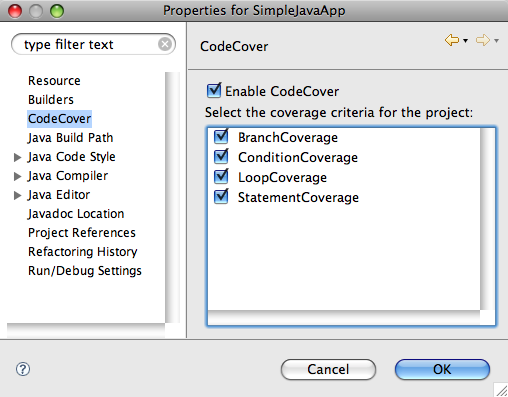
Open the Properties of your project, e.g. by selecting the project in the Package Explorer and choosing the Properties menu item of the Project menu. Once the Properties are visible, select the CodeCover tab. This tab contains a checkbox which you use to enable/disable CodeCover for the project.
Running a Java project with CodeCover:

Make sure CodeCover is activated for the Java project you want to run. Open the Launch Configuration you want to use, e.g. by selecting the "Open Run Dialog…" menu item of the Run menu and selecting it in the dialog which is displayed. You'll notice an additional CodeCover tab there. Select the CodeCover tab and click on the "Run with CodeCover" checkbox. Click the Run button to start the execution. In case you want to run your application without CodeCover later, simply go back to the CodeCover tab and uncheck the "Run with CodeCover" checkbox.
Once the execution of the application is finished, the gathered coverage data will be shown in the Coverage View.
Correlation Matrix
The correlation matrix is used to compare test cases of a test session container with each other and to display the result of this comparison. There are two different visualizations to choose from:
- "TreeViewer"
- Matrix
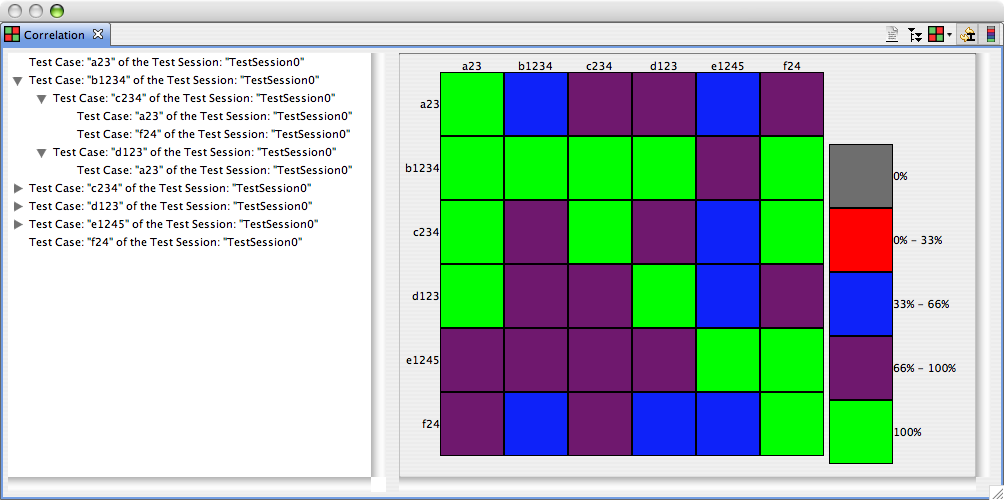
The "TreeViewer" displays those test cases, that are completely covered by other test cases. As can be seen in the screenshot, test case "a23" has no children, meaning it does not cover any other test case completely. On the other hand, test case "b1234" has multiple children, meaning that it, e.g., covers "a23" completely. If two test cases cover each other completely, they are displayed in the same tree node, separated by a ",", as they are essentially equal to each other.
The matrix displays not only those test case, that are completely covered, but also every degree of coverage. Those degrees are visualized with colors and detailed in the legend, that can be seen in the right-hand side of the view. The colors, and the ranges they represent, can be adjusted in the preferences of the plugin Preferences Page. The matrix is to be read from the left, e.g. test case "d123" covers test case "b1234" to a degree in the range of 66% - 100%, since the color of the square is purple. A tooltip is displayed for every square of the matrix, which, amongst other things, contains the exact degree of coverage and for every test case labels, such as "a23", which contains the full name of the test case and the name of the test session the test case belongs to.
The toolbar contains five items:
- Export the currently displayed matrix data into a .csv file
- Hide top-level tree items
- Choose correlation metric and calculate correlation
- Automatically calculate correlation
- Show legend
The "Export to csv" toolbar item (![]() ) can be used to save the currently displayed correlation percentages into a file, using the "comma seperated value" format. The user can specify the location and the name of the file.
) can be used to save the currently displayed correlation percentages into a file, using the "comma seperated value" format. The user can specify the location and the name of the file.
The "Hide top-level tree items" toolbar item (![]() ) can be used to hide all those tree
nodes in the top-most level, that have no children – those test cases that do not
cover any other test cases completely – since they are not as interesting to the
user, as those that have children, and could point to redundancies in the user test
suite.
) can be used to hide all those tree
nodes in the top-most level, that have no children – those test cases that do not
cover any other test cases completely – since they are not as interesting to the
user, as those that have children, and could point to redundancies in the user test
suite.
The correlation criteria, that are used in the comparison, can be chosen with the
"Choose and calculate correlation" toolbar item (![]() ). A popup menu appears, which contains
an entry for every one of the correlation criteria, and an additional entry for
all available criteria. This means, that the user can either choose to use one criteria
or all of them in the comparison. With a push of the button itself, the comparison
can be started manually, which recalculates the correlation of the test cases and
refreshes the "TreeViewer" and the matrix.
). A popup menu appears, which contains
an entry for every one of the correlation criteria, and an additional entry for
all available criteria. This means, that the user can either choose to use one criteria
or all of them in the comparison. With a push of the button itself, the comparison
can be started manually, which recalculates the correlation of the test cases and
refreshes the "TreeViewer" and the matrix.
The test cases, that are part of the comparison can be chosen in the Test Session View. It is possible, with the "Automatically calculate correlation"
toolbar item (![]() ) to specify, whether the correlation should be calculated every time
the selection in the "test session view" is changed, or only on the users request.
Since the calculation can be potentially time-consuming, given enough test cases,
this can save system resources and improve performance.
) to specify, whether the correlation should be calculated every time
the selection in the "test session view" is changed, or only on the users request.
Since the calculation can be potentially time-consuming, given enough test cases,
this can save system resources and improve performance.
The legend, that is located to the right-hand side of the matrix can be hidden,
or shown again, with the "Show legend" toolbar item (![]() ).
).
Test Sessions View
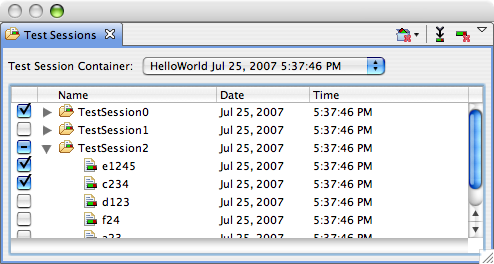
The Test Sessions view lists the test sessions ( ) and the contained test cases (
 ) of the active test session container (
 ). Test sessions contain
the coverage measurements of a test run divided into test cases.
). Test sessions contain
the coverage measurements of a test run divided into test cases.
The drop-down list on the top of the Test Sessions view lists all test session containers of all opened projects. You can activate a test session container by choosing one of the drop-down list.
You can activate test cases using the check boxes nearby the names of the test cases. Coverage Measurements of activated test cases are visualized by the Coverage view, the Correlation view and the code highlighting in editor windows. Bear in mind that there is a difference between activating test sessions/test cases, which is done via the check boxes, and selecting test sessions/test cases, which is done by simply clicking on the row of the relevant test session/test case.
The Test Sessions view's toolbar offers the following actions:
-
 Save active test session container
 - Saves the currently activated test session container. Test Session Containers are saved automatically if you select an other one, if you close a project or if you quit Eclipse. Thus you need this action only if you explicitly want to save the active test session container at a specific point in time. But usually you won't need this action because the plugin handles all save operations automatically.
-
 Delete active test session container
 - Delete the currently activated test session container.
 Merge selected test sessions or test cases
 - Opens a dialog which guides you in merging test sessions or test cases.
 Delete selected test sessions/test cases
 - Delete the selected test sessions and test cases.
The Test Sessions view's context menu offers the following actions:
- Select all
- Select all test cases and test sessions of the currently active test session container.
- Activate all
- Activate all test cases of the currently active test session container.
- Deactivate all
- Deactivate all test cases.
- Delete
- Delete the selected test sessions and test cases.
- Properties
- View or change the properties (name and comment) of the selected test session or test case.
Coverage View
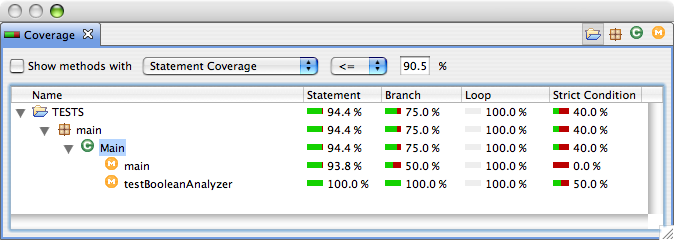
The Coverage view visualizes the coverage measurements of the active test cases. The displayed tree shows the structure of the tested software at the point in time the measurements were taken. Each row displays the coverage measurement of the corresponding element which name and type is displayed in the first column. Whereas elements are either java types or the project the active test cases belong to, in this case the corresponding coverage measurements are the combined measurements of the whole project. The coverage measurements themselves are displayed in the rest of the columns, starting from the second one. The values of the measurements are given in percent, whereas 0.0% means that nothing was covered by the active test cases and 100.0% percent means full coverage of the corresponding element.
The Coverage view's toolbar offers four actions which control which type is displayed as the top-level-type in the tree. Or in other words, the actions set the type by which methods are grouped. All levels above the selected type are simply not displayed. For example if you select classes as the top-level-type, packages and the project won't be visible. The following actions of the toolbar (from left to right) control this feature:
- Group by project
- Sets the project to the top-level type.
- Group by packages
- Sets packages to the top-level type.
- Group by classes
- Groups methods by classes, interfaces, enums and annotations.
- Group by methods
- Lists all methods.
Above the tree visualization a simple filter is shown which filters methods by their degree of coverage. You can activate or deactivate the filter using the (leftmost) check box.
Boolean Analyzer

The Boolean Analyzer shows the boolean value of each basic boolean term, operator term and the root term according to evaluations of the condition which are recorded during the execution of the SUT. This data is presented in a table. The operators, operands and brackets define the columns and the evaluations are shown as rows in the table. In addition, a column for test cases is added. In that column one can see the test cases which covered the evaluation and the number of execution. Two table values of a column may contain green background. This represents that the basic boolean term of that column is covered according to the strict condition coverage criterion. If a column of a basic boolean term does not contain any colored values then the term is not covered. There are two ways to select a condition in the Boolean Analyzer. First, there are combo-boxes for classes and conditions. The second way is to select the keyword of the condition in the source code, right-click, and select the "Analyze Term" item in the context menu, which will automatically select the condition in the Boolean Analyzer.
Highlighting
CodeCover highlights the coverage produced by the active test cases in the default java editor of Eclipse. The results of all enabled metrics are shown at the same time. To show if an element is covered, the background color of the pieces of code that represent it is changed to something else than white (the default), we say it is highlighted. For example the keyword for is highlighted in green, if the corresponding for loop is covered fully by loop coverage, while the whole statement i = i + 7; is highlighted in red if it is not covered.
Semantic of the colors
Each element is either not coverable by a metric and not highlighted or it has so called coverable items from exactly one metric which determine the highlighting. A coverable item is the atomic thing for which a metric decides if it is covered or not. The highlighting color of an element tells you if all, some or none of its coverable items are covered. The default Colors are:
- Green: Fully covered by the metric, i.e. all coverable items are covered
- Yellow: Partly covered by the metric, i.e. some coverable items are covered, not all. A tool tip tells you which are not covered.
- Red: not covered by the metric, i.e. no coverable items are covered.
Now we will go through all of Java's elements that can be covered by one of CodeCover's metrics and explain their coverable items. The elements are grouped by Metric.
Here is some example code with comments to give you an idea which elements can be highlighted and which coverable items they have. Some coverable items are listed explicitly after "cov:" in the comments:
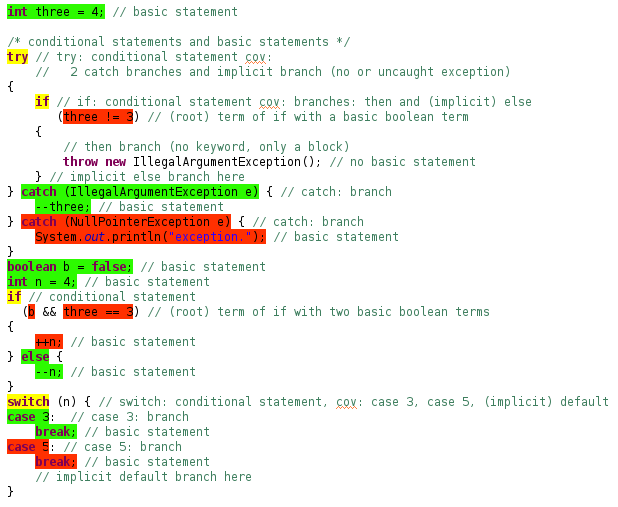
Statement coverage
Statement coverage covers only so called basic statements, like i++;. They have exactly one coverable item, which is covered if the statement was executed successfully at least once. Throwing an exception is not considered a successful execution.
Basic statements don't contain other statements and can always have statements following them. The former excludes branching statements and loops, which contain blocks of statements. This avoids highlighting the same element by two different metrics. The latter excludes return and throw, which can't be instrumented for technical reasons. Look at the statements around them to see if they were executed.
Branch coverage
Branch coverage covers conditional statements (like if) and their individual branches (like else). Each branch has exactly one coverable item, which is covered if it was taken, i.e. the control flow entered its body once. A branching statement has the coverable items of all its branches. There are also branches which have no element that can be highlighted, like the 'then' branch of an if. It has no keyword in Java. And implicit branches, which are omitted in the code, like the else-branch of an if without an else block.
Conditional coverage
Conditional coverage covers basic boolean terms that are part of the conditional expression of a loop or branching statement. A basic boolean term, sometimes called condition, is a boolean term that is not constructed of other boolean terms. Examples are boolean variables and method calls that return boolean.
They have one coverable item, which is covered if the term can affect the result of its encompassing decision. In other words it is covered, if the term is evaluated to both true and false and the change from true to false (or false to true) changes the result of the whole condition while every other basic boolean term of the conditional expression remains constant or is not evaluated.
Loop coverage
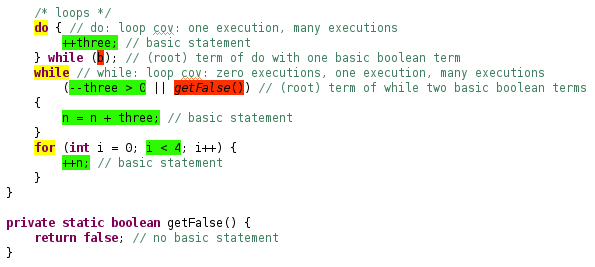
Loop coverage covers for, while and do-while represented by their keywords for, while and do. A loop has at most three coverable items representing the number of iterations. They are body executed in one run:
- zero times (not for do-while)
- one time
- more than one time.
Each is covered it the loop has been run once with a suitable number of iterations of the loop body.
Changing colors
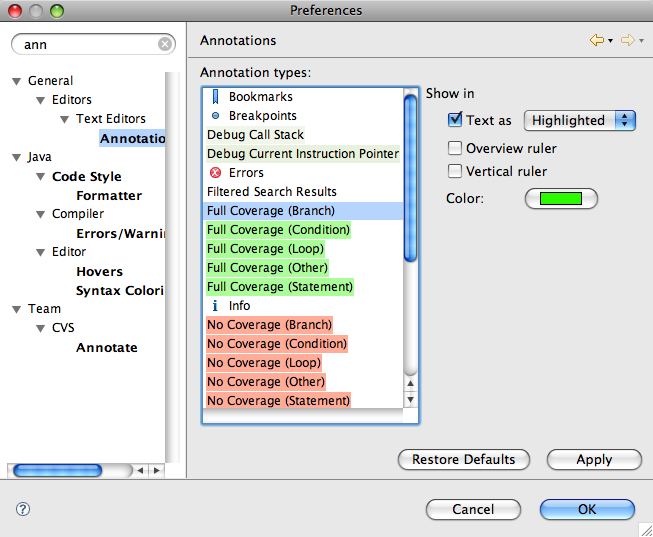
The highlighting is realized with Eclipse's annotations. For every coverage status (covered fully, covered partly and not covered) there is one annotation type per metric. Branch, Loop, Statement and Conditional represent the metrics included within the CodeCover release and Other is used for metrics added by plugins. You can change the layout of all of these 15 different annotations globally for your workspace in your Eclipse preferences dialog. The dialog can be found by opening Window > Preferences and entering "ann" into the search field:
Import Wizards
Coverage Log Import Wizard
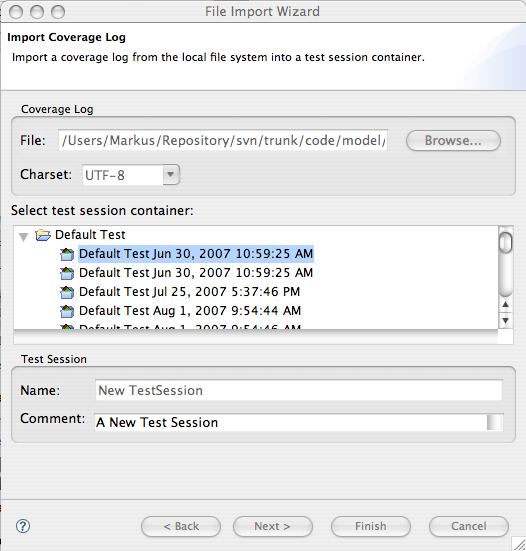
This import wizard imports a coverage log from a file into a selected test session container of an open project.
A coverage log is created during the run of a coverage measurement on a software. It collects the measurements taken during the run. To evaluate the coverage log (for example, view the coverage results in the Coverage view), you have to import it into a test session container, where it will be saved as a test session.
In the File field, type or browse to select the file which contains the coverage log to import. The charset of the coverage log file can be selected in the Charset field. If you're not sure about the charset, try CodeCover's default charset which is already selected. In the tree select the test session container you want to import the coverage log file into. The last step is to enter a name and comment for the Test Session which will contain the measurements of the imported coverage log.
Test Session Container Import Wizard
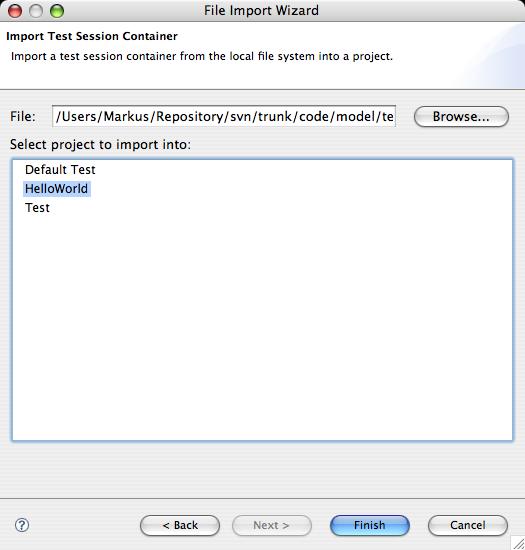
This import wizard imports a test session container from a file into an Eclipse project. The process is pretty simple. In the File field, type or browse to select the file which contains the test session container to import. Then select the project to import into from the list beneath the File field and click on Finish.
Export Wizards
Coverage Result Export Wizard
This export wizard can be used to export the coverage results as either a test session container, or a report.
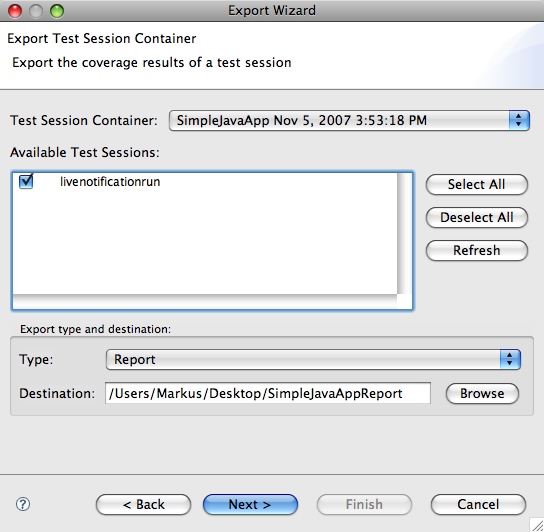
The test session container holding the coverage results can be selected in the combo box. The list of test sessions can be chosen in the list of available test sessions. The type combo box is used to select the kind of export and the destination can be specified with the "Browse" button. If the export type is "CodeCover Test Session Container", this page can be closed with the "Finish" button. If it is "Report", the "Finish" button is disabled and the "Next" button can be used to navigate to the next page.
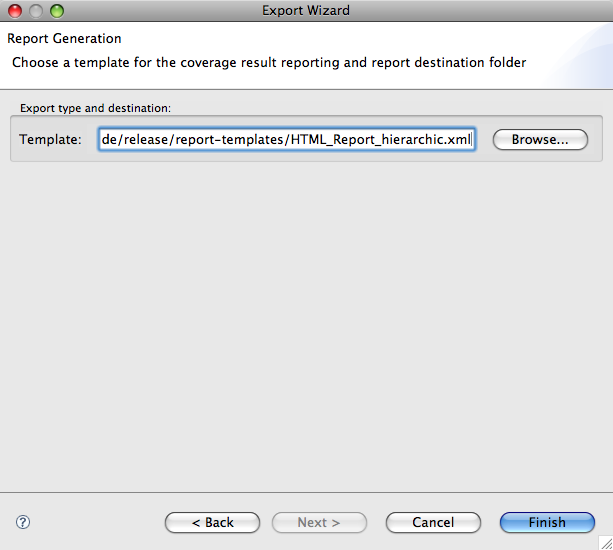
The template that is used in the creation of the report can be specified here. The shipped templates can be found in the eclipse/plugins/org.codecover.report.*/report-templates/ directories. The "Finish" button initiates the creation of the report.
CodeCover Measurement for JUnit
As you know, you can use Test Cases to subdivide the whole coverage measurement of a coverage run. But how to do that in Eclipse? A mechanism is to use the Live Notification, described in the next paragraph. But for the most projects, you have already created a JUnit test suite – why not use this? You can use this test suite to test your software and in the meanwhile, CodeCover uses the test case information to subdivide the coverage measurement.
As a precondition, you have to activate CodeCover for the project you want to use CodeCover with. This is explained in the section Build.
Then you have to create a run for your test suite—respectively test case. Therefore, open your JUnit TestSuite or TestCase class, use the run button and select Run As  CodeCover Measurement for JUnit. This run entry is also available in the context menu Run As of the editor or Package Explorer.
This run will automatically start the Eclipse JUnit test runner and when it is finished, the coverage results appear in the Test Sessions View. Per default this session has the name "eclipse run". You can change this name by editing its Properties. If you need to, you can inspect the test cases' properties. If there occurred any errors or failures during the run, it is logged to the comment of a test case.
For more advanced features, you can use the run dialog to adapt the run configuration. For example, you can chose between JUnit 3 and JUnit 4:

Live Notification
Connecting to the running program:
Live Notification is a mechanism to interact with the coverage logging inside the instrumented SUT. Its main purpose is to manually define test case boundaries from within eclipse and send them to the SUT.
In the following examples replace 1234 with the port to use for Live Notification. If your SUT already uses JMX, make sure that neither SSL nor password authentication is required and use the port you defined.
Enabling Live Notification in the SUT:
If your Application does not support JMX you have to enable it.
To enable JMX: Open the Run Dialog. Select your launch configuration and open its Arguments tab. In the text field VM Arguments add the String "-Dcom.sun.management.jmxremote -Dcom.sun.management.jmxremote.port=1234 -Dcom.sun.management.jmxremote.ssl=false -Dcom.sun.management.jmxremote.authenticate=false" (without the quotes). Now apply the changes to finish the configuration.
If you start this launch configuration the SUT listens on port 1234 for JMX clients.
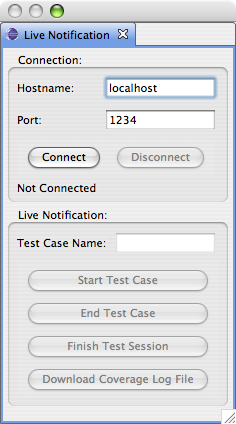
Using the Live Notification view:
First open the Live Notification view that comes with CodeCover. Then connect to a running SUT: Enter the hostname of the host the SUT runs on and the port to connect to. Then click on the connect button.
Now you may use the Live Notification features (see below).
Defining test case boundaries:
To start a new testcase first enter its name into the text field then click the start button. To end the test case click the end button.
If you don't start a testcase, the whole program run will be recorded as one testcase with the name "UNNAMED".
Finish testing and downloading coverage log file:
To finish the test, click the button "Finish Test Session" and then the button "Download Coverage Log File" to get the coverage data of the finished test session.
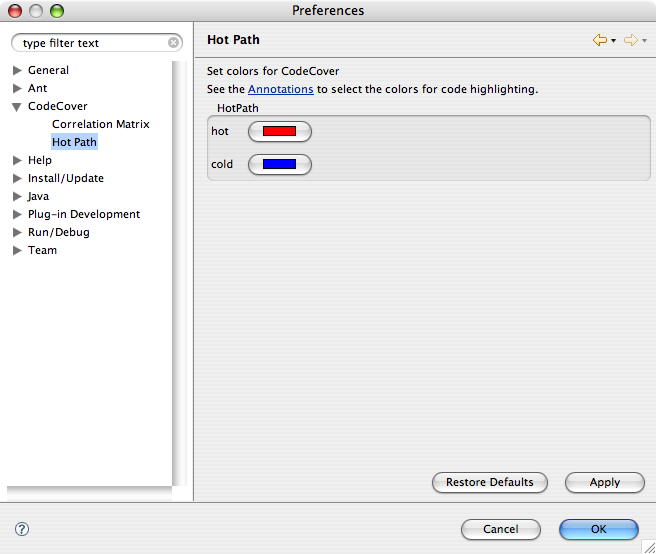
Preferences
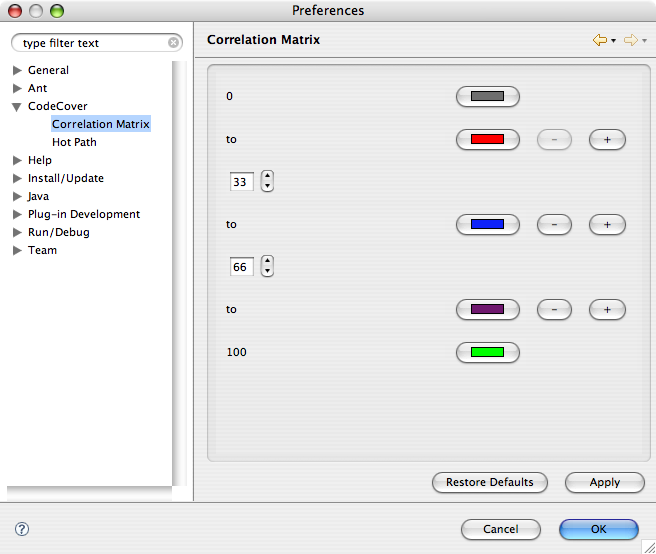
In the preferences dialog, you can specify in the CodeCover-Tab the colors for the hotpath, the ranges and colors for the correlation matrix and the path for further CodeCover-Plugins.